BCT (Batch 2018) Paper Presentation ! Mr. Brijesh Pandya, presented the Paper under the guidance of Prof. Komal and Prof. Tapan during M2023 and URP 2023

Certificate of Paper Presentation This is to certify that Dr./Mr./Ms. Brijesh Pandya of CEPT University, Ahmedabad has presented a paper entitled “Robotics Application For Road Crack Detection” in the International Conference on Sustainable Experimentation and Modeling in Civil Engineering (SEMCE-2023) held on August 10-11, 2023, organized by the School of Civil Engineering, Lovely Professional University, Punjab in association with the Department of Civil Engineering, Dr B R Ambedkar National Institute of Technology, Jalandhar. Date of Issue : 29-08-2023 Place : Phagwara (Punjab), India Prepared by (Administrative Officer-Records) Program chair (SEMCE-2023) General Chair (SEMCE-2023) Organizing Secretary (SEMCE-2023)
Brijesh Pandya1 Bachelor’s in Construction Technology, Faculty of Technology, CEPT University, Ahmedabad, India-380009 brijesh.ug180118@cept.ac.in | Mob: 9727074116 Tapan Betai2 Visiting Faculty, Faculty of Technology, CEPT University, Ahmedabad, India-380009 tapan.betai@cept.ac.in | Mob: 9016929970 Komal Parikh3 Assistant Professor, Faculty of Technology, CEPT University, Ahmedabad, India380009 komal.parikh@cept.ac.in I Mob: 9687886181 Corresponding email: brijesh.ug180118@cept.ac.in Abstract. India has the second-largest road network in the world, and it is challenging to keep up such a substantial infrastructure. Robots are a more powerful tool for data collection over conventional methods. This research focuses on identifying asphalt road cracks and pavement defects using a robotic sensor-based system along with image processing. Python and OpenCV (an image processing library) have been used to find flaws in pavement's images taken from a camera mounted on a robotic vehicle. The robotic vehicle consists of 49 distance sensors mounted in one line, which measure the depth of the defect stored to the cloud-based system through the internet. The intervention of collecting the data from two different methods and processing was implemented on one of the roads in Ahmedabad city. The sensor system can validate the technical aspects of the data on the crack identified from the image by measuring its accuracy. Both the data collection and processing methods provide the area of the defect with 80% accuracy.… 1. Introduction India boasts the second largest road network in the world, spanning a massive 5.89 million kilometers. This extensive road infrastructure is vital for the country's transportation system, accommodating 90% of passenger traffic and facilitating the transportation of 64.5% of the nation's commodities. However, despite its immense reach, there remains a persistent challenge in retrieving crucial road information, such as pavement type and condition, particularly in metropolitan areas. Traditional evaluation methods employed to assess road information are not only inefficient but also prone to inaccuracies. Moreover, the subjective nature of the conclusions drawn about the extent of damage on roadways often leads to variations in assessment outcomes. To address these issues, there is a growing need for the integration of automated and semi-automated processes into road evaluation procedures. The utilization of computers in data collection and processing
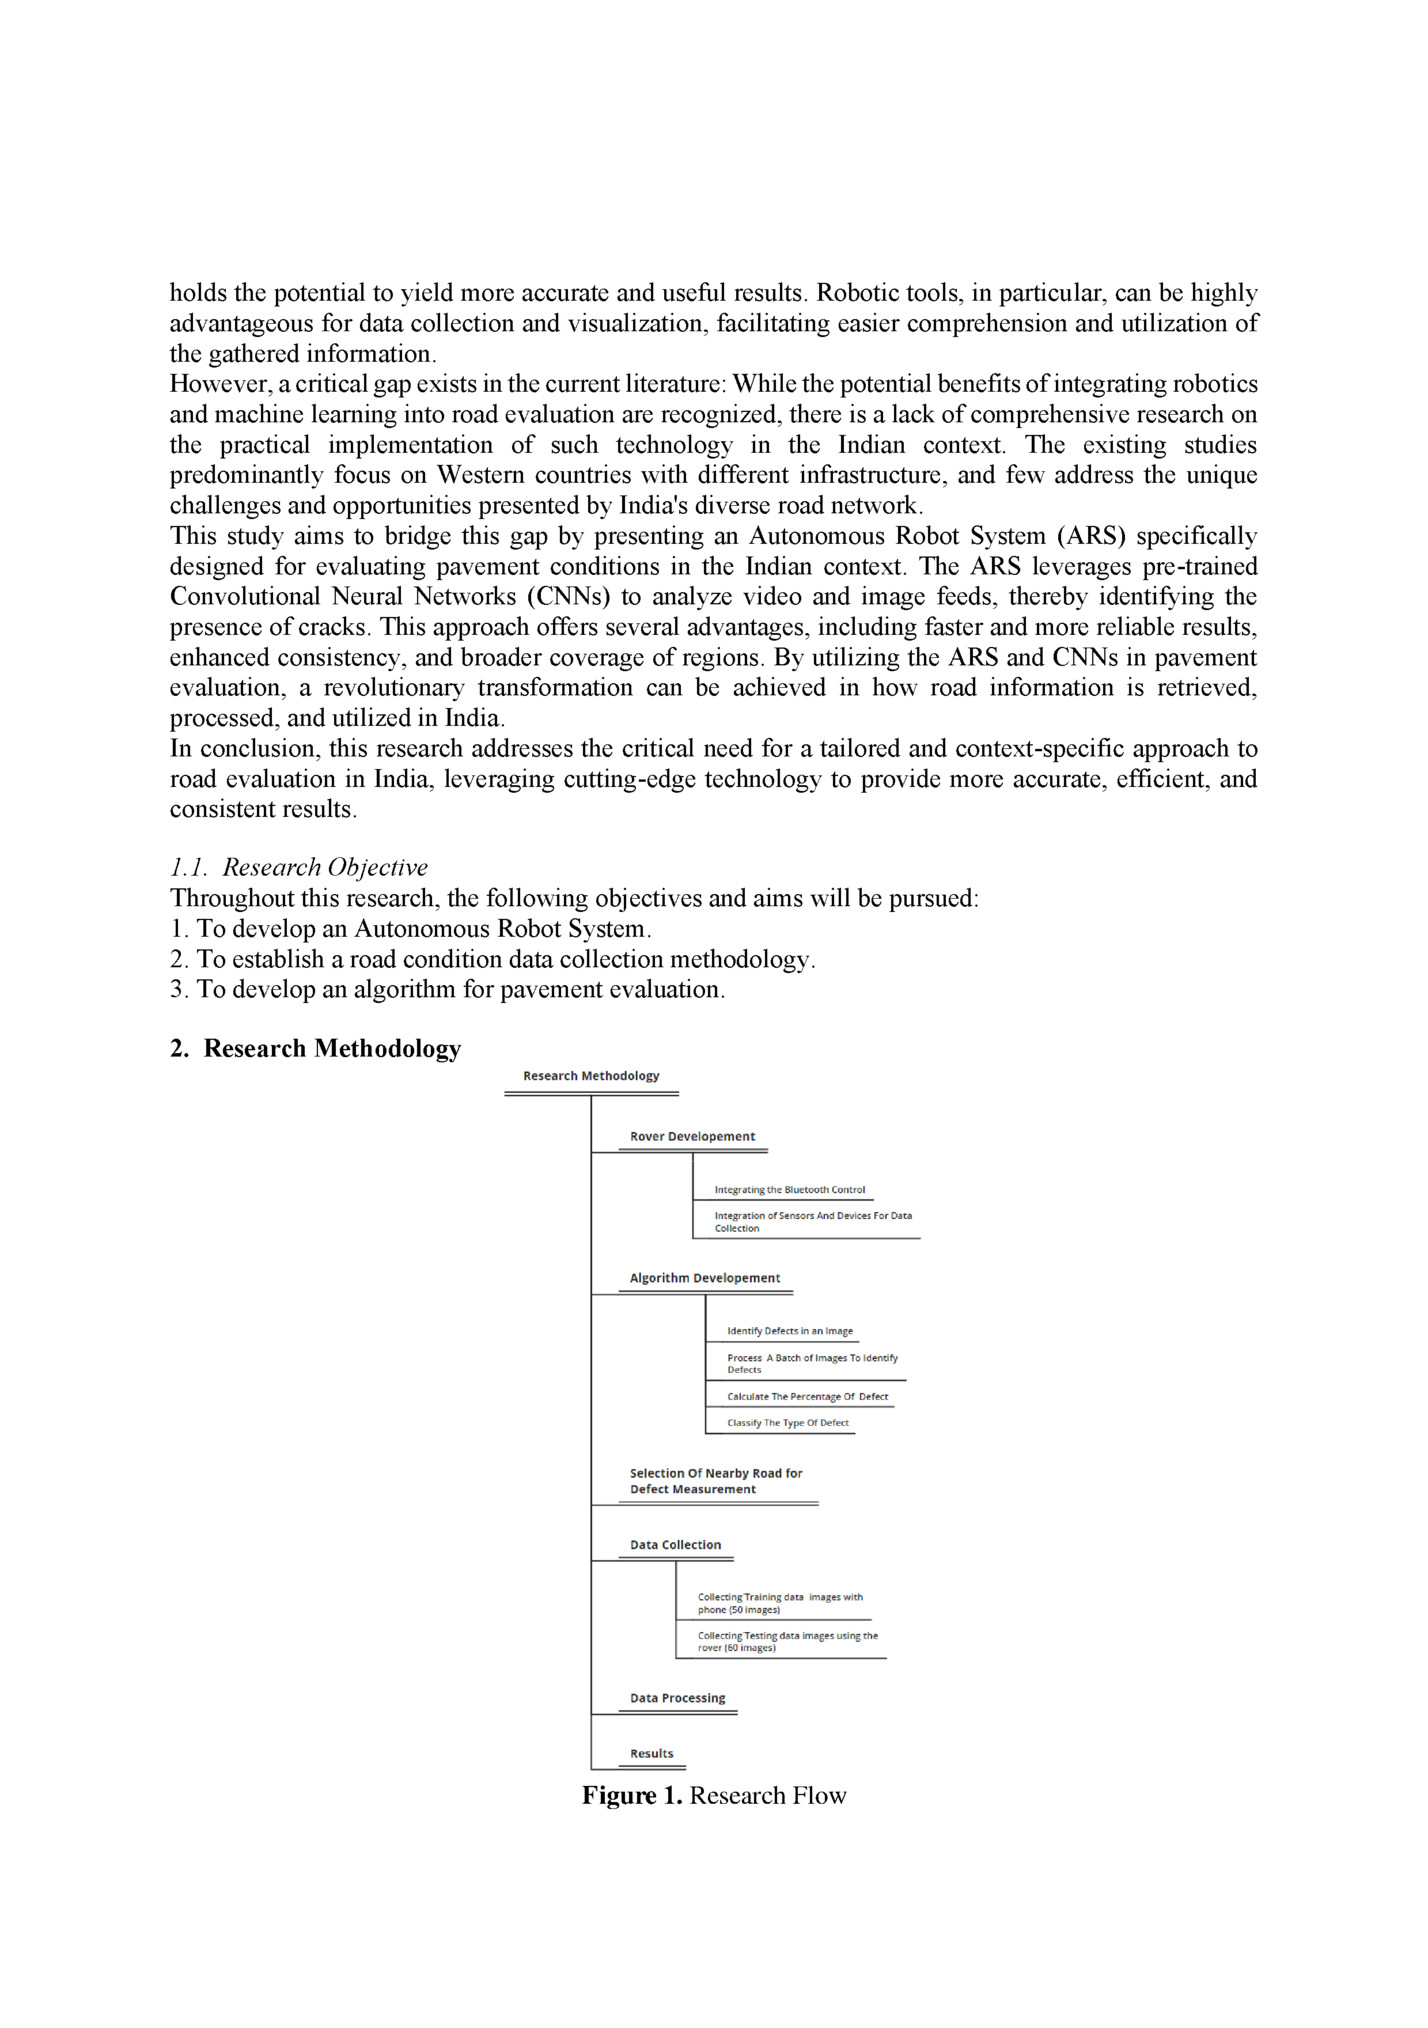
advantageous for data collection and visualization, facilitating easier comprehension and utilization of the gathered information. However, a critical gap exists in the current literature: While the potential benefits of integrating robotics and machine learning into road evaluation are recognized, there is a lack of comprehensive research on the practical implementation of such technology in the Indian context. The existing studies predominantly focus on Western countries with different infrastructure, and few address the unique challenges and opportunities presented by India's diverse road network. This study aims to bridge this gap by presenting an Autonomous Robot System (ARS) specifically designed for evaluating pavement conditions in the Indian context. The ARS leverages pre-trained Convolutional Neural Networks (CNNs) to analyze video and image feeds, thereby identifying the presence of cracks. This approach offers several advantages, including faster and more reliable results, enhanced consistency, and broader coverage of regions. By utilizing the ARS and CNNs in pavement evaluation, a revolutionary transformation can be achieved in how road information is retrieved, processed, and utilized in India. In conclusion, this research addresses the critical need for a tailored and context-specific approach to road evaluation in India, leveraging cutting-edge technology to provide more accurate, efficient, and consistent results. 1.1. Research Objective Throughout this research, the following objectives and aims will be pursued: 1. To develop an Autonomous Robot System. 2. To establish a road condition data collection methodology. 3. To develop an algorithm for pavement evaluation. 2. Research Methodology Figure 1. Research Flow
gather data, including images, videos, and distance readings, and to identify pavement defects. The algorithm underwent a comprehensive stepwise development process that considered several key factors in the identification of pavement defects. 2.1. Algorithm Development and Optimization: Initial Testing: The algorithm development commenced with the collection of test data, consisting of images and videos captured by the ARS. These initial datasets were used to establish the foundational framework for defect identification. Refinement of Flaw Identification Technique: In this stage, we focused on enhancing the accuracy of the algorithm's defect identification technique. The algorithm was fine-tuned to recognize specific pavement defects, taking into account factors such as crack width, depth, and pattern. Simultaneous Image Processing: To optimize efficiency, the algorithm was further developed to process multiple photos simultaneously. This enhancement aimed to increase the speed and effectiveness of defect identification. Lighting and Shadow Correction: The algorithm addressed issues related to lighting and shadows through improved pre-processing techniques. These adjustments ensured more consistent defect identification results under varying lighting conditions. Data Logging and Accuracy Assessment: The final iteration of the algorithm was designed to log the identified defects into an Excel sheet for further analysis. To evaluate its performance, the algorithm was tested on a set of 60 rover images using AutoCAD, achieving an 80% accuracy rate. This accuracy assessment confirmed the reliability and efficiency of the flaw detection algorithm. 2.2. Rover Development: The research project aimed to develop a functional and effective rover to meet specific objectives for pavement defect assessment. The project was executed in stages, which included the following key steps: Chassis Construction and Electrical Component Testing: The initial phase involved the construction of the rover's chassis and thorough testing of its electrical components. This phase ensured that the rover's structural integrity and basic functionality were in place. Top Frame Construction: Subsequently, the top frame of the rover was constructed. During this phase, a suitable camera module was selected and evaluated for optimal performance in capturing pavement images.

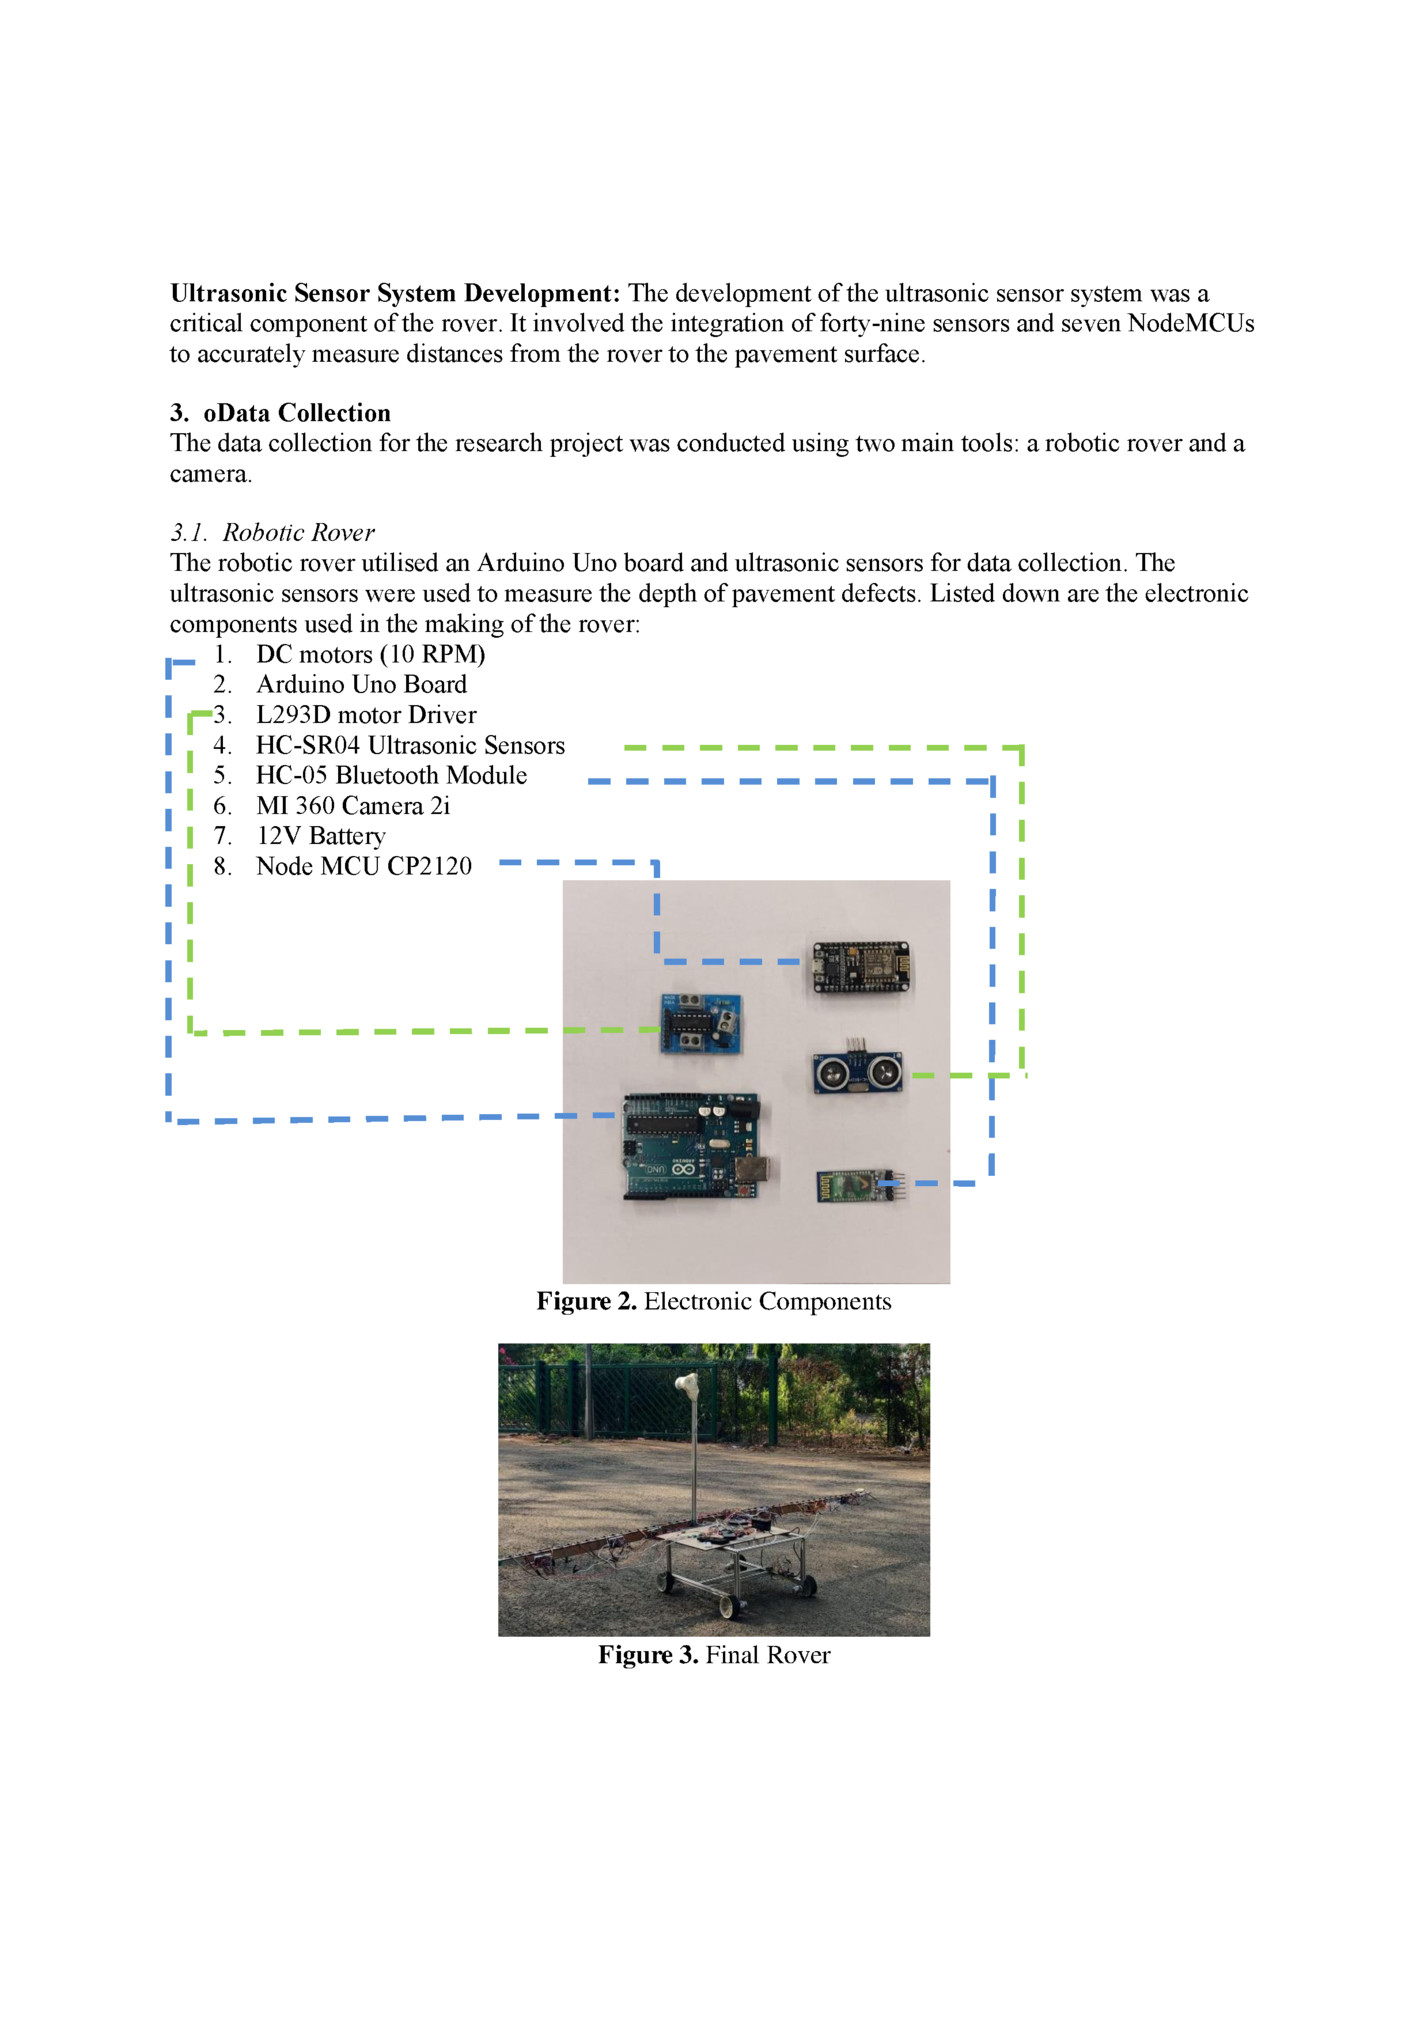
critical component of the rover. It involved the integration of forty-nine sensors and seven NodeMCUs to accurately measure distances from the rover to the pavement surface. 3. oData Collection The data collection for the research project was conducted using two main tools: a robotic rover and a camera. 3.1. Robotic Rover The robotic rover utilised an Arduino Uno board and ultrasonic sensors for data collection. The ultrasonic sensors were used to measure the depth of pavement defects. Listed down are the electronic components used in the making of the rover: 1. DC motors (10 RPM) 2. Arduino Uno Board 3. L293D motor Driver 4. HC-SR04 Ultrasonic Sensors 5. HC-05 Bluetooth Module 6. MI 360 Camera 2i 7. 12V Battery 8. Node MCU CP2120 Figure 2. Electronic Components Figure 3. Final Rover
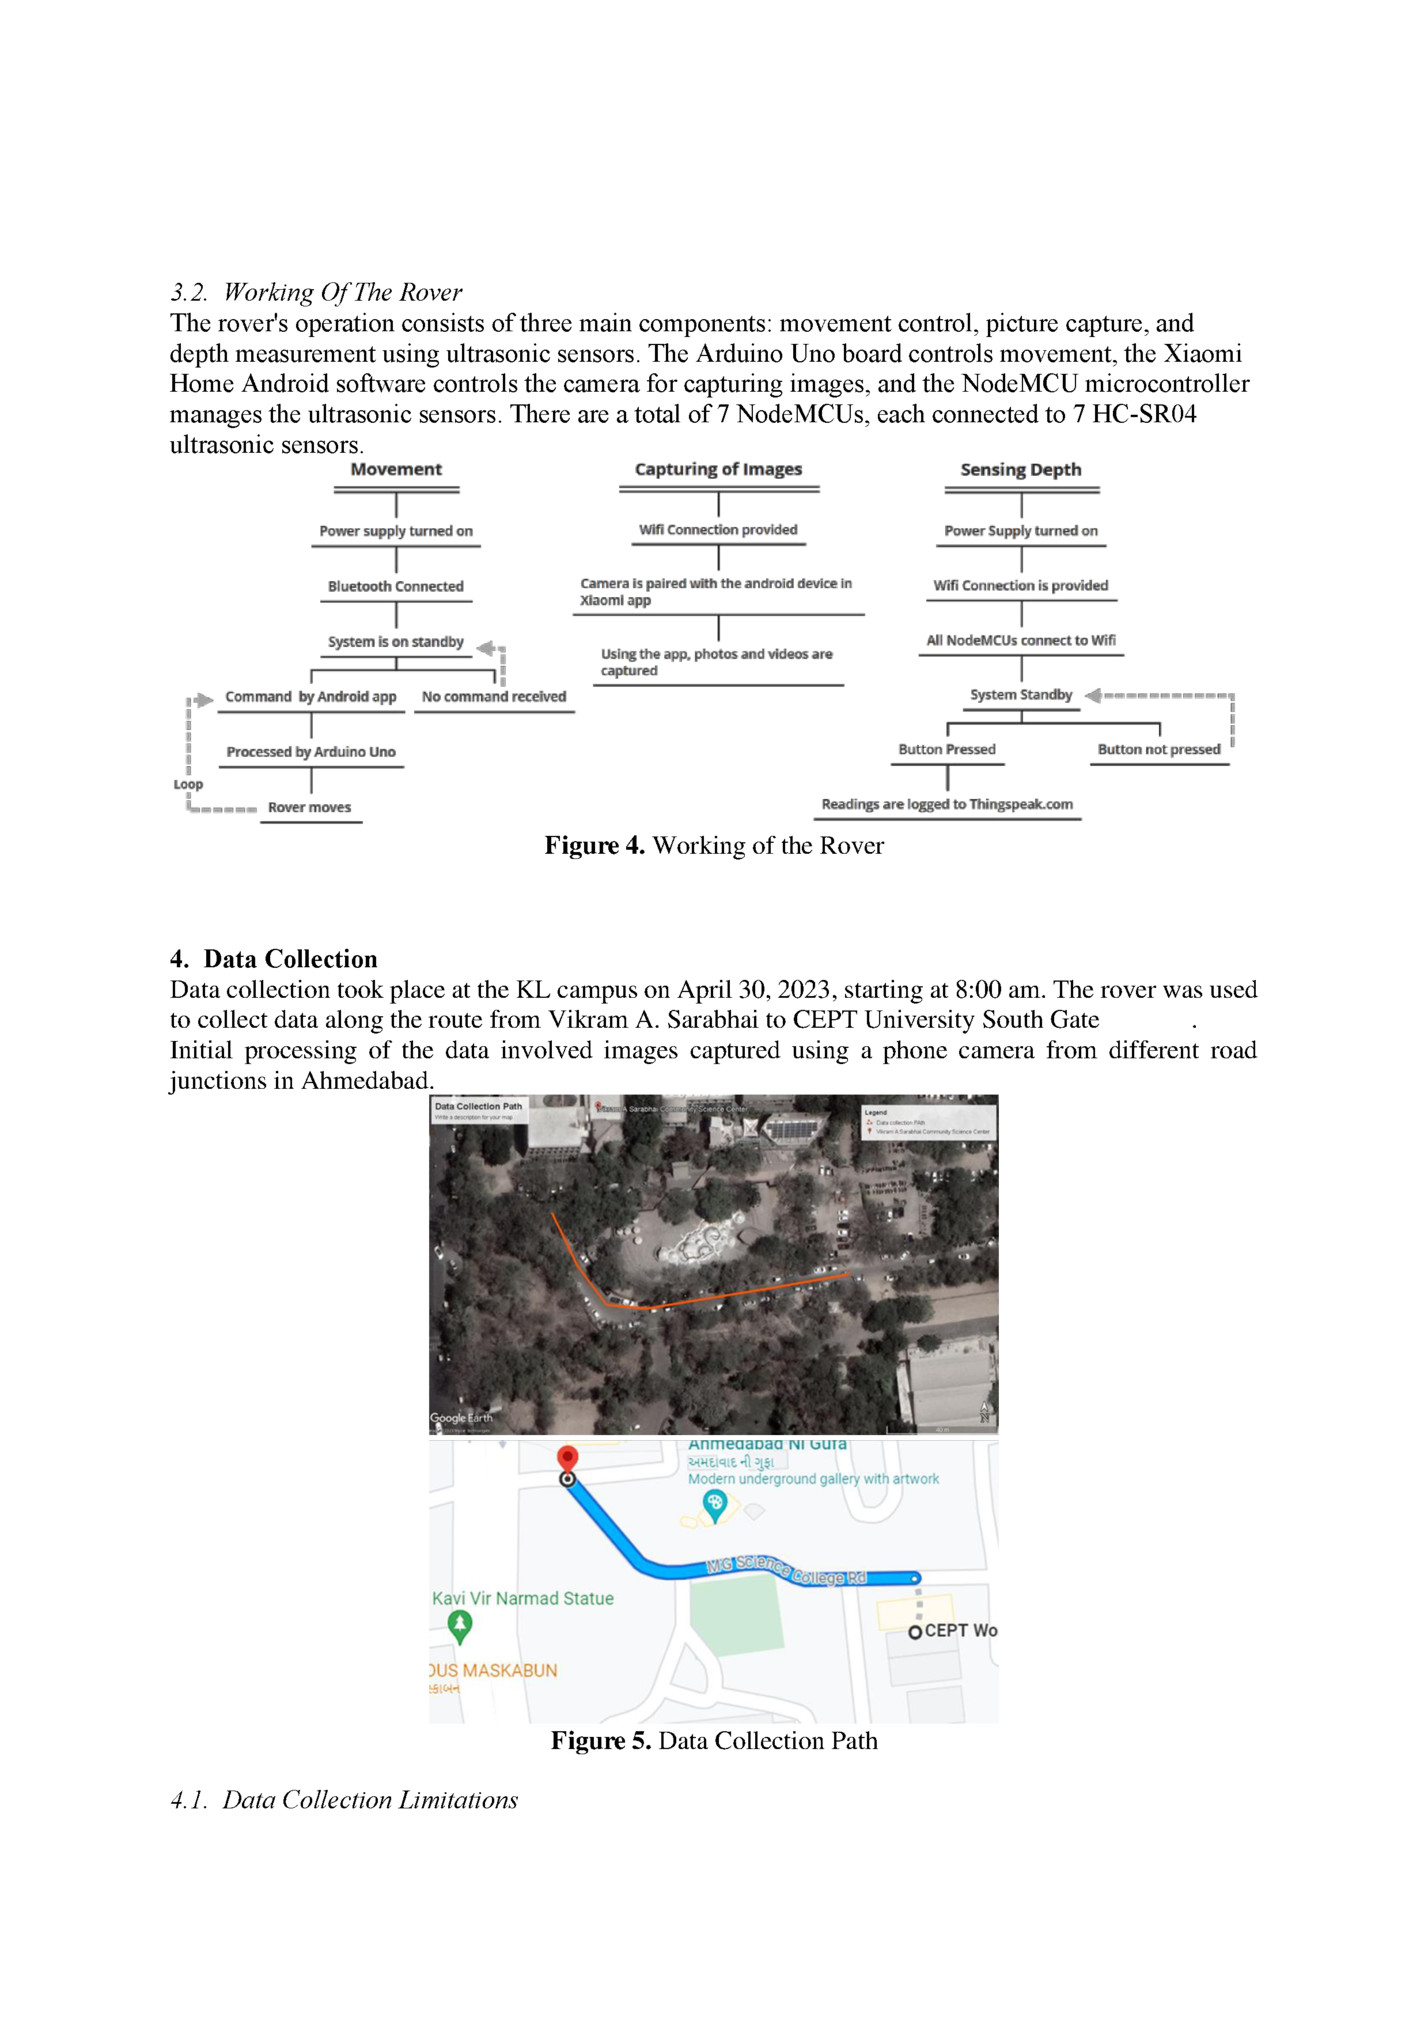
The rover's operation consists of three main components: movement control, picture capture, and depth measurement using ultrasonic sensors. The Arduino Uno board controls movement, the Xiaomi Home Android software controls the camera for capturing images, and the NodeMCU microcontroller manages the ultrasonic sensors. There are a total of 7 NodeMCUs, each connected to 7 HC-SR04 ultrasonic sensors. Figure 4. Working of the Rover 4. Data Collection Data collection took place at the KL campus on April 30, 2023, starting at 8:00 am. The rover was used to collect data along the route from Vikram A. Sarabhai to CEPT University South Gate . Initial processing of the data involved images captured using a phone camera from different road junctions in Ahmedabad. Figure 5. Data Collection Path 4.1. Data Collection Limitations
were some limitations and challenges encountered during the process. These include: 1. Difficulty in calibrating 50 ultrasonic sensors simultaneously due to cable management issues. 2. The camera requiring connection to an Android device and network calibration before each deployment. 3. Challenges in transporting the rover due to its size. These errors and challenges can be addressed in the future by using more advanced equipment and hardware. 5. Data analysis and results The results are presented through photos and an Excel spreadsheet. The output photos compare the original and processed images, along with the defect percentage. The Excel sheet contains one column with the percentage of identified defects and another column with the image names. The HC-SR04 measurements are registered on thingspeak.com via WiFi and exported as a CSV file. The data is then used to create an illustration of a typical stretch of pavement. Figure 6. Result Images
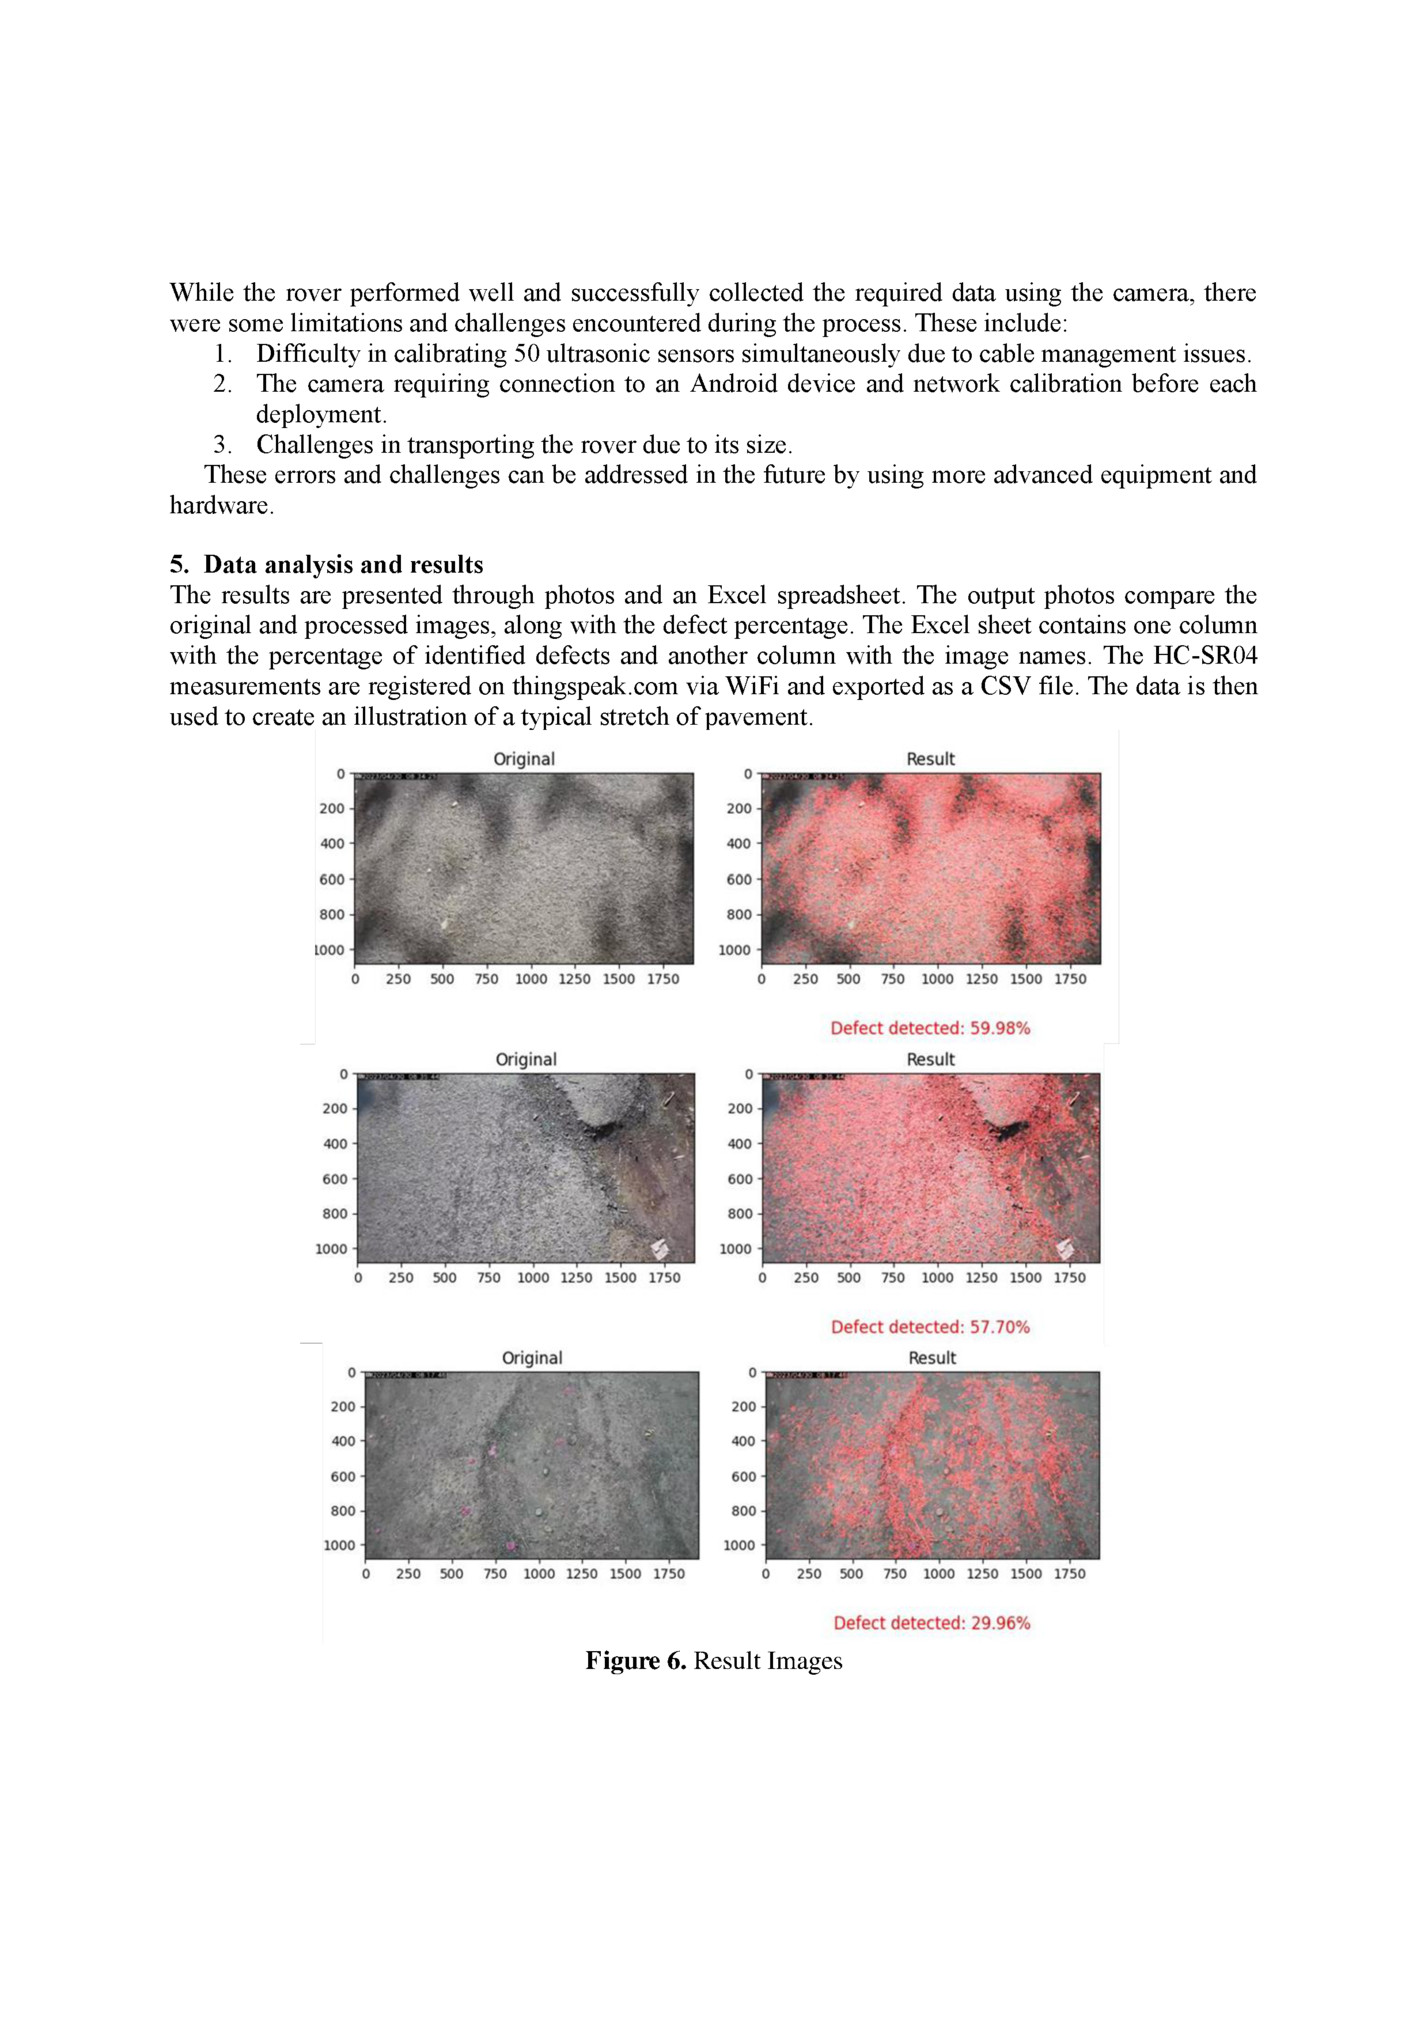
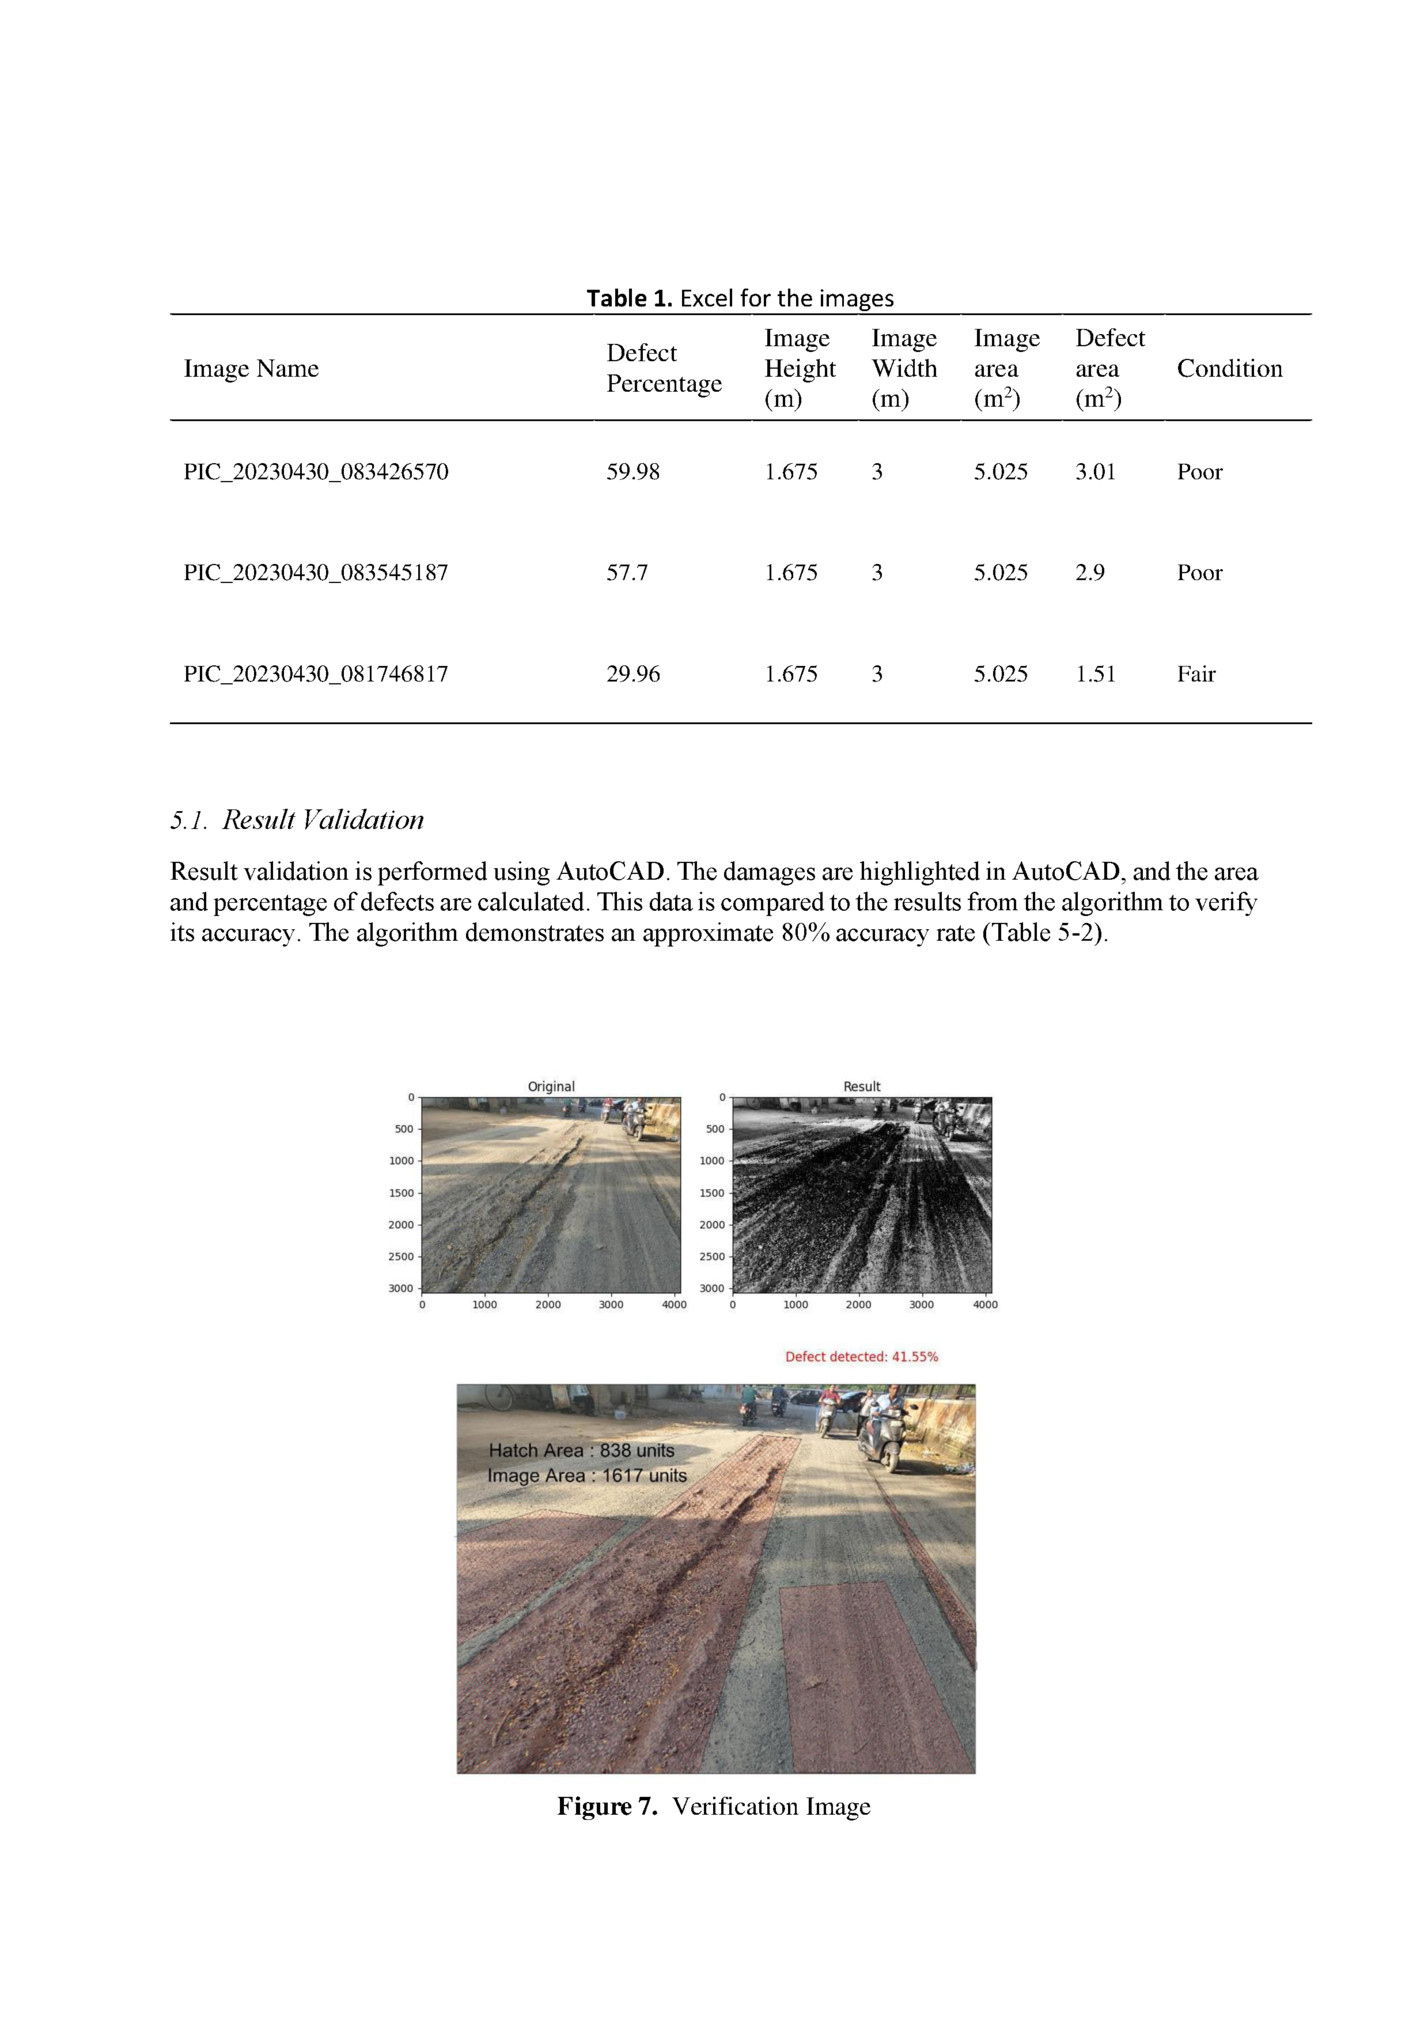
Table 1. Excel for the images Image Image Defect Height Width Percentage (m) (m) Image area (m2) Defect area (m2) Condition PIC_20230430_083426570 59.98 1.675 3 5.025 3.01 Poor PIC_20230430_083545187 57.7 1.675 3 5.025 2.9 Poor PIC_20230430_081746817 29.96 1.675 3 5.025 1.51 Fair 5.1. Result Validation Result validation is performed using AutoCAD. The damages are highlighted in AutoCAD, and the area and percentage of defects are calculated. This data is compared to the results from the algorithm to verify its accuracy. The algorithm demonstrates an approximate 80% accuracy rate (Table 5-2). Figure 7. Verification Image
Fleepit Digital © 2021