VOL.1 S T U D I O S DATA SCIENCE BTECH 3RD YEAR UNIT 1 TO UNIT 5 35 PAGES
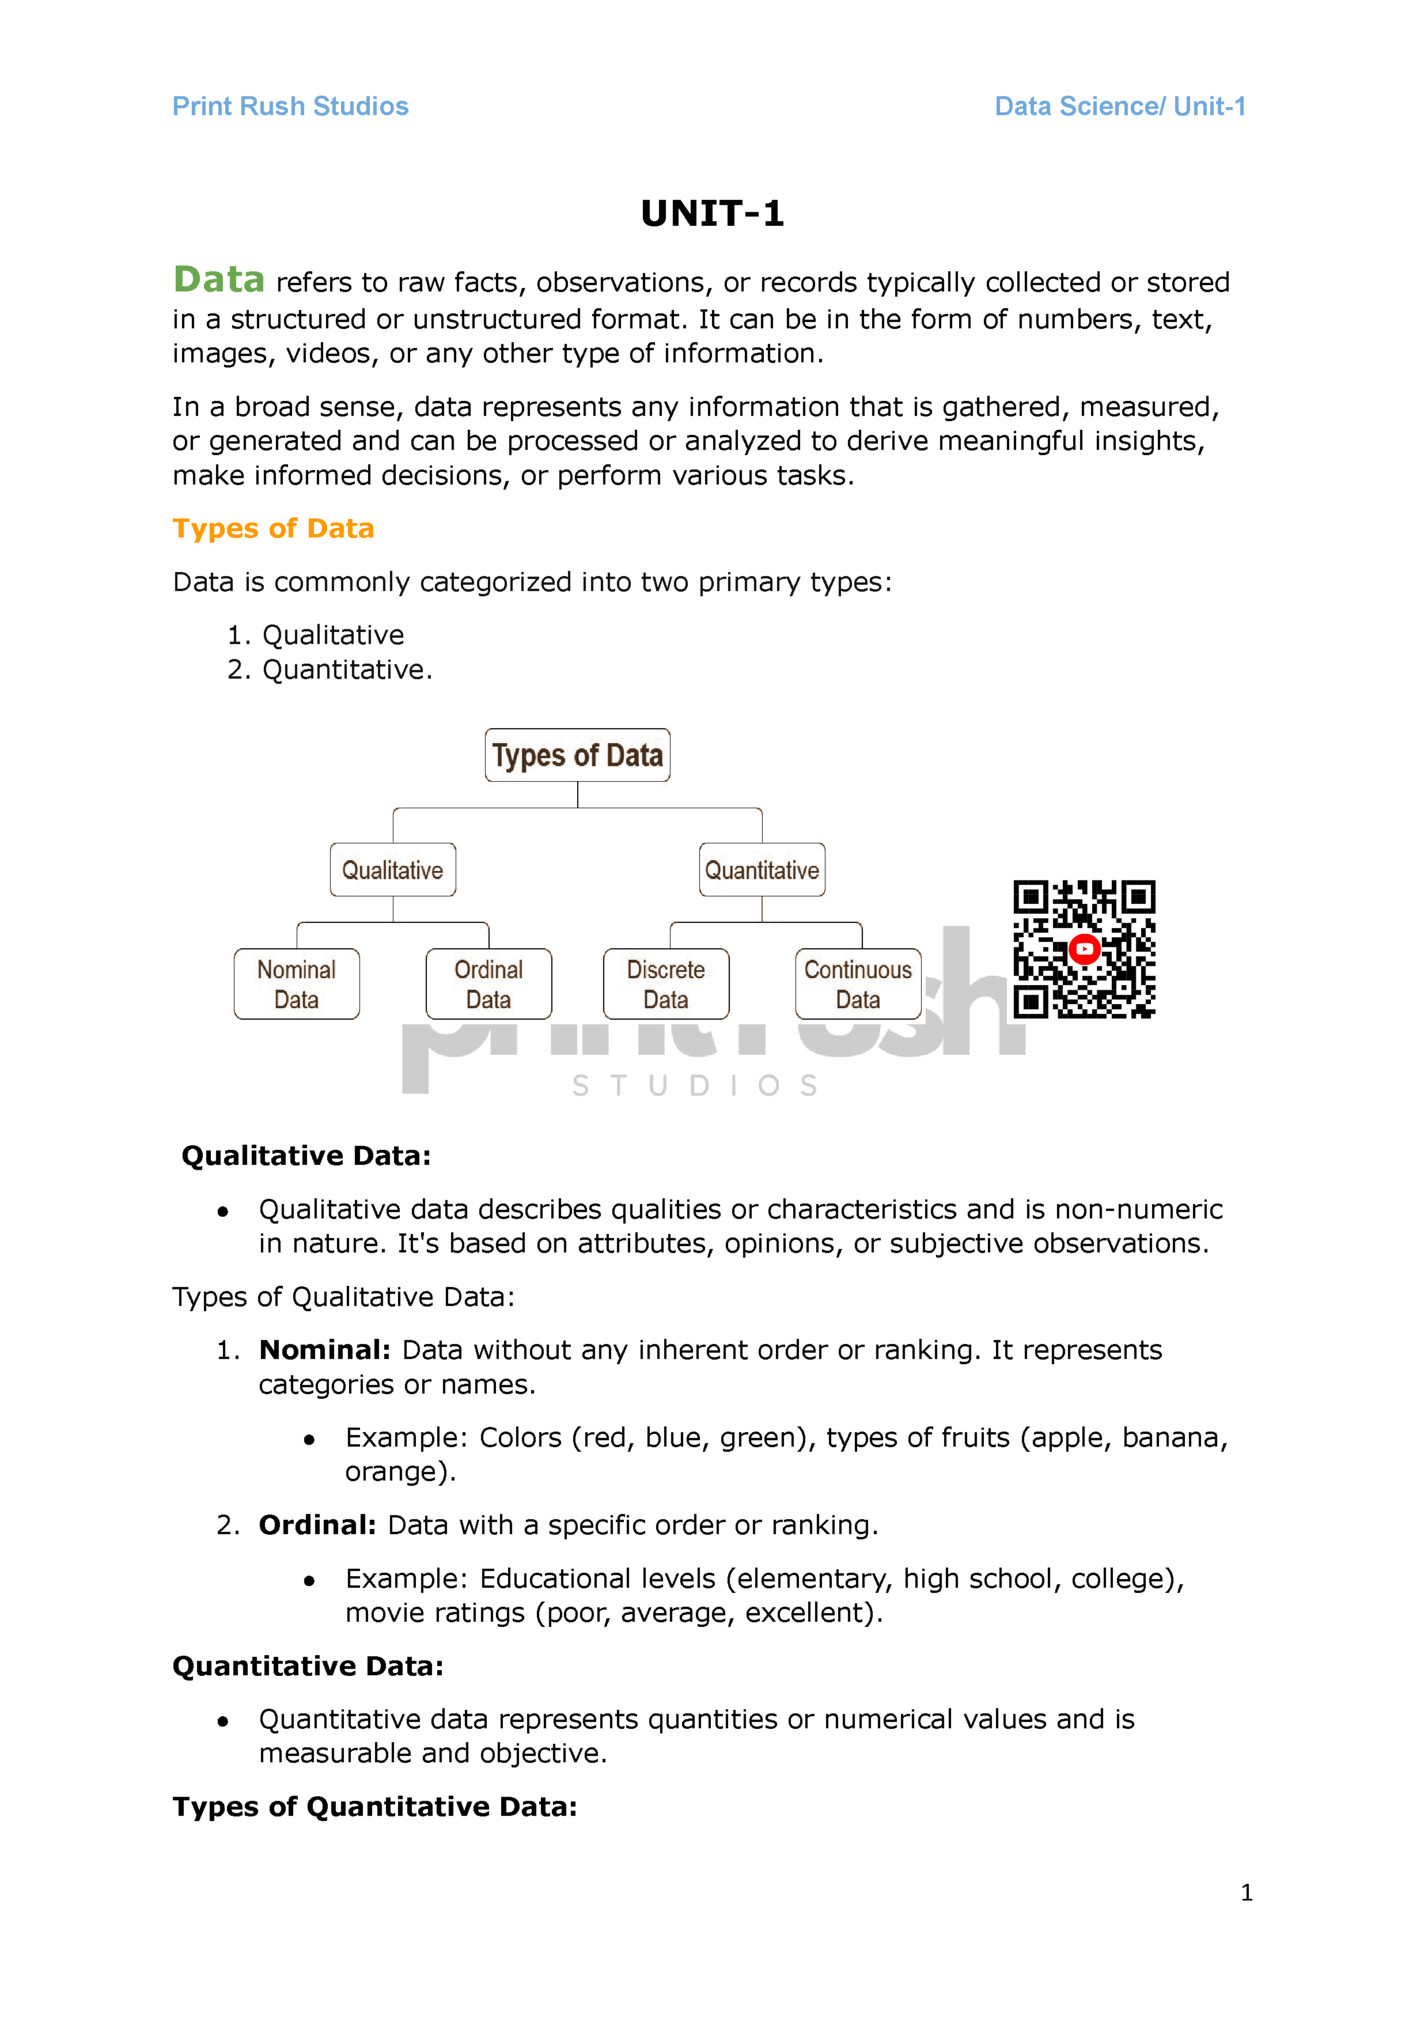
Data Science/ Unit-1 UNIT-1 Data refers to raw facts, observations, or records typically collected or stored in a structured or unstructured format. It can be in the form of numbers, text, images, videos, or any other type of information. In a broad sense, data represents any information that is gathered, measured, or generated and can be processed or analyzed to derive meaningful insights, make informed decisions, or perform various tasks. Types of Data Data is commonly categorized into two primary types: 1. Qualitative 2. Quantitative. Qualitative Data: ● Qualitative data describes qualities or characteristics and is non-numeric in nature. It's based on attributes, opinions, or subjective observations. Types of Qualitative Data: 1. Nominal: Data without any inherent order or ranking. It represents categories or names. ● Example: Colors (red, blue, green), types of fruits (apple, banana, orange). 2. Ordinal: Data with a specific order or ranking. ● Example: Educational levels (elementary, high school, college), movie ratings (poor, average, excellent). Quantitative Data: ● Quantitative data represents quantities or numerical values and is measurable and objective. Types of Quantitative Data: 1
Data Science/ Unit-1 1. Discrete: Consists of whole numbers or counts, typically representing distinct and separate values. ● Example: Number of students in a class (1, 2, 3...), the count of books on a shelf. 2. Continuous: Data that can take on any value within a range, often measured on a scale. ● Example: Height, weight, temperature, time. Structured Data: This type of data is highly organized and follows a specific format. It's typically stored in databases with rows and columns. Examples include data in relational databases, Excel spreadsheets, or CSV files. Each piece of information is clearly defined and fits into a well-defined schema. For instance, a table of customer information with columns like ID, Name, Email, and Address is structured data. Semi-Structured Data: This type of data doesn’t fit neatly into tables or relational databases but has some structure. It may contain tags, markers, or a hierarchy that allows for organization but doesn't necessarily conform to a rigid schema like structured data. Examples include JSON files, XML files, and NoSQL databases. An example would be a JSON document storing information about a product where the structure allows for flexibility in adding different attributes but maintains a general format. Unstructured Data: This type of data lacks a specific structure or format, making it the most challenging to analyze. It doesn’t fit into traditional databases or tables. Examples include text documents, emails, videos, images, social media posts, audio recordings, etc. These contain valuable information but require more advanced techniques like natural language processing or computer vision to extract meaningful insights. For instance, analyzing customer sentiment from a collection of social media posts would involve dealing with unstructured text data. Data Science encompasses the study of data, including its collection, processing, analysis, visualization, and interpretation. It involves the application of statistical models, machine learning algorithms, data mining techniques, and computational tools to uncover patterns, trends, correlations, and valuable insights from structured and unstructured data. Description of Data Science In practice, data science involves several key components: 1. Data Collection and Preprocessing: Gathering data from various sources, cleaning it, and preparing it for analysis by addressing missing values, inconsistencies, or errors. 2

Data Science/ Unit-1 2. Exploratory Data Analysis (EDA): Understanding the data through visualization, summary statistics, and initial analysis to identify patterns and relationships. 3. Statistical Analysis and Modeling: Applying statistical techniques and building predictive models to extract insights or make future predictions based on the data. 4. Machine Learning and AI: Utilizing algorithms and artificial intelligence to develop models that learn from data, enabling tasks like image recognition, natural language processing, recommendation systems, and more. 5. Big Data Technologies: Handling large volumes of data using specialized tools and technologies designed to manage, process, and analyze massive datasets efficiently. 6. Data Visualization: Presenting findings and insights through visual representations such as charts, graphs, and dashboards to facilitate understanding and decision-making. ⇨ History and Development of Data Science: 1.Foundational Era: Data science's roots lie in statistics, computer science, and data analysis, with pioneers like John W. Tukey emphasizing its importance in the 1960s and 1970s. 2.Database and Computing Advancements: The 1980s and 1990s saw the rise of relational databases, laying the groundwork for managing structured data, while data mining techniques started uncovering patterns in large datasets. 3.Digital Age and Big Data: The late 1990s and 2000s marked the explosion of digital data from the internet and various sources, leading to the term "big data." Technologies like Hadoop emerged to handle large-scale data processing. 4.Formalization of Data Science: The 2010s witnessed the formal recognition of data science as a distinct discipline, integrating statistical analysis, machine learning, and domain expertise. 5.Technological Advancements: Advancements in computational power, cloud computing, and the development of sophisticated algorithms fueled data science's growth, enabling applications in predictive analytics, AI-driven insights, and optimization. 6.Current Trends: Data science continues to evolve with AI, deep learning, NLP, and computer vision. Ethical considerations, interdisciplinary collaborations, and the integration of data-driven strategies in diverse fields shape its current trajectory. 3
The primary components of Data Science: Data Science/ Unit-1 [End Sem 2019] Statistics and Probability: Fundamental knowledge in statistics helps in understanding data patterns, distributions, and making inferences. Probability theory is essential for modeling uncertainty and randomness in data. 1. Programming: Proficiency in programming languages like Python, R, or SQL is crucial for data manipulation, analysis, and building models. It also involves familiarity with libraries and frameworks like Pandas, NumPy, TensorFlow, or scikit-learn. 2. Machine Learning: This involves using algorithms and statistical models that enable systems to learn patterns and make predictions or decisions without explicit programming. Supervised, unsupervised, and reinforcement learning are common types used in data science. 3. Data Cleaning and Preprocessing: Raw data often requires cleaning to remove inconsistencies, handle missing values, and format it for analysis. Preprocessing involves normalization, transformation, and feature engineering to prepare data for modeling. 4. Data Visualization: Presenting data visually through graphs, charts, and dashboards helps in understanding trends, patterns, and insights. Tools like Matplotlib, Seaborn, Tableau, or Power BI are used for effective visualization. 5. Domain Knowledge: Understanding the context of the data within a specific industry or field is crucial. It aids in formulating relevant questions, interpreting results, and applying data-driven solutions effectively. ⇨ Key terminologies related to data science: 1. Big Data: Refers to large and complex datasets that traditional data processing applications might struggle to handle due to their volume, variety, velocity, and veracity. 2. Machine Learning: A subset of AI that involves teaching computers to learn from data without explicit programming, enabling them to improve predictions or perform tasks based on experience. 3. Artificial Intelligence (AI): The simulation of human intelligence processes by machines, including learning, reasoning, problem-solving, perception, and decision-making. 4. Predictive Analytics: The use of statistical techniques and machine learning algorithms to forecast future outcomes or trends based on historical data. 4
Data Science/ Unit-1 5. Data Mining: The process of discovering patterns, correlations, or anomalies within large datasets to extract valuable insights and make data-driven decisions. 6. Data Visualization: The graphical representation of data to present information in a visual format, making it easier to understand, analyze, and derive insights. 7. Deep Learning: A subset of machine learning that uses neural networks with multiple layers to learn intricate patterns and representations from data, often used in tasks like image or speech recognition. ⇨ Basic framework and architecture [End sem 2019] 1.Data Collection: Gathering data from various sources, such as databases, APIs, sensors, social media, or files. 2.Data Storage: Storing collected data in repositories like databases, data lakes, or cloud storage systems. 3.Data Preprocessing: Cleaning, transforming, and preparing raw data for analysis by addressing missing values, outliers, or inconsistencies. 4.Exploratory Data Analysis (EDA): Understanding the data through visualizations, summary statistics, and initial analysis to uncover patterns, trends, and relationships. 5.Feature Engineering: Selecting, extracting, or creating relevant features from the data to improve machine learning models' performance. 6.Model Development: Building and training machine learning or statistical models using algorithms to derive insights or make predictions based on the prepared data. 7.Model Evaluation: Assessing the performance of models using various metrics to determine their accuracy, precision, recall, or other criteria. 8.Deployment: Implementing or integrating the developed models into systems or applications for real-world use, often using APIs or other deployment mechanisms. 9.Monitoring and Maintenance: Continuously monitoring the models' performance in production, making necessary updates or improvements, and ensuring their reliability and accuracy over time. 10.Feedback Loop: Incorporating feedback and insights gained from model performance or user interactions back into the data collection or model development process for continuous improvement. ⇨ Data science’s role in today's business world [End Sem 2019] 5
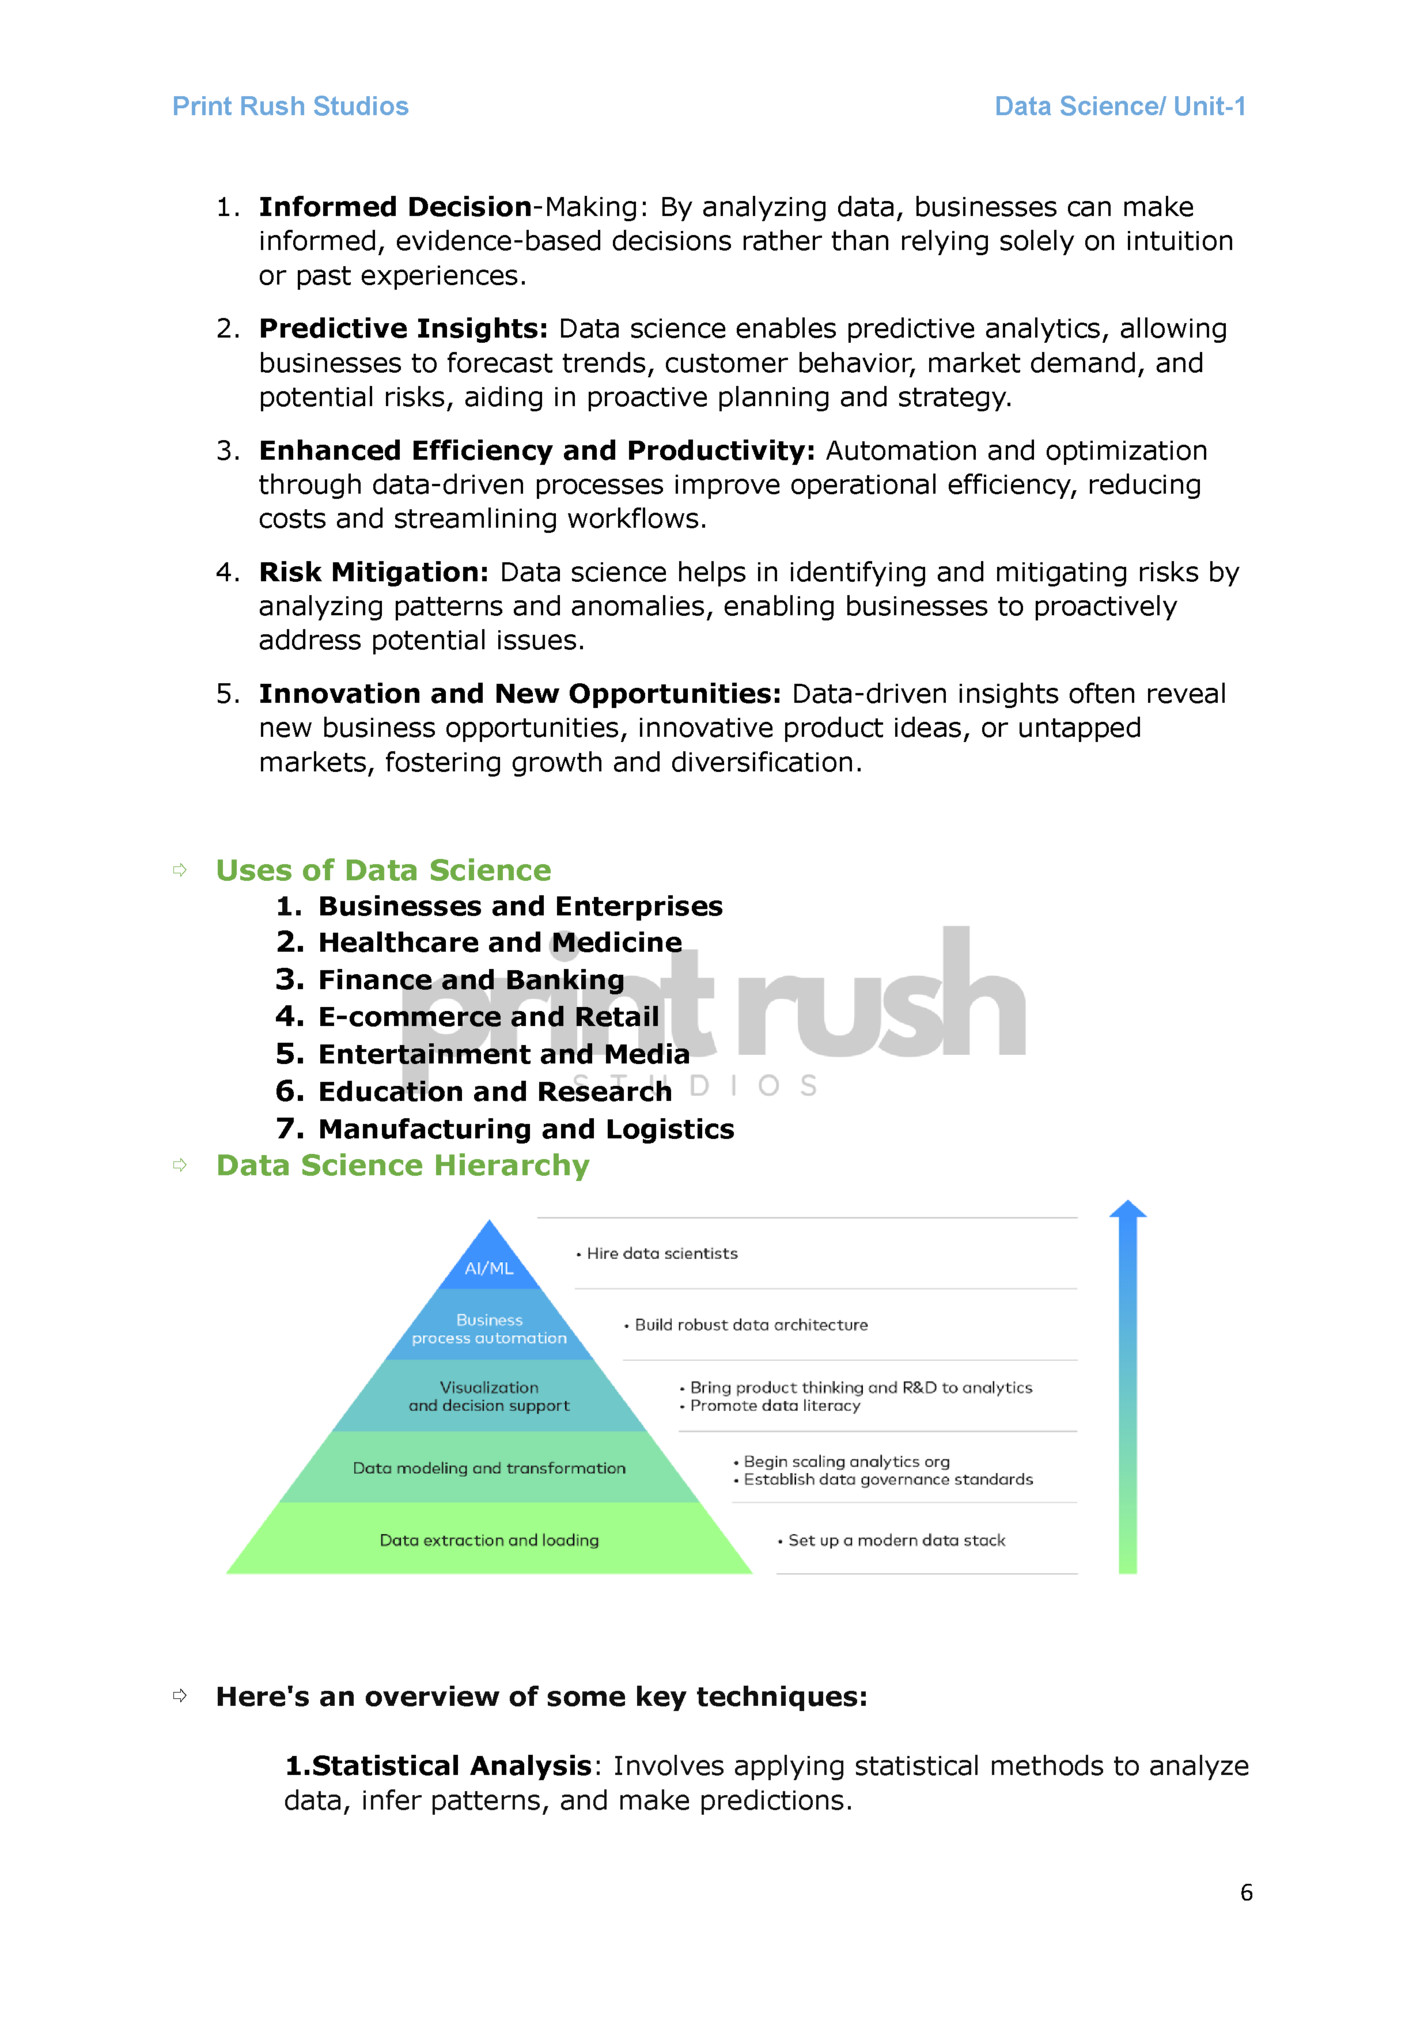
Data Science/ Unit-1 1. Informed Decision-Making: By analyzing data, businesses can make informed, evidence-based decisions rather than relying solely on intuition or past experiences. 2. Predictive Insights: Data science enables predictive analytics, allowing businesses to forecast trends, customer behavior, market demand, and potential risks, aiding in proactive planning and strategy. 3. Enhanced Efficiency and Productivity: Automation and optimization through data-driven processes improve operational efficiency, reducing costs and streamlining workflows. 4. Risk Mitigation: Data science helps in identifying and mitigating risks by analyzing patterns and anomalies, enabling businesses to proactively address potential issues. 5. Innovation and New Opportunities: Data-driven insights often reveal new business opportunities, innovative product ideas, or untapped markets, fostering growth and diversification. ⇨ Uses of Data Science 1. Businesses and Enterprises 2. Healthcare and Medicine 3. Finance and Banking 4. E-commerce and Retail 5. Entertainment and Media 6. Education and Research 7. Manufacturing and Logistics ⇨ Data Science Hierarchy ⇨ Here's an overview of some key techniques: 1.Statistical Analysis: Involves applying statistical methods to analyze data, infer patterns, and make predictions. 6
Data Science/ Unit-1 2.Big Data Analytics: Techniques and tools to handle and extract insights from massive, complex, and diverse datasets that cannot be managed by traditional data processing applications. 3.Data Mining: Focuses on discovering patterns and knowledge from large datasets using methods at the intersection of machine learning, statistics, and database systems. 4.Deep Learning: Subsets of machine learning using neural networks with multiple layers to process and analyze data, used for image recognition, natural language processing (NLP), etc. 5.Predictive Analytics: Using historical data to predict future outcomes or behaviors. 6.Data Visualization: Representing data graphically to identify trends, patterns, and relationships. ⇨ BIG Data Big data refers to large volumes of structured, semi-structured, and unstructured data that inundates a business on a day-to-day basis. It's characterized by its massive volume, variety, velocity, and often its veracity. The concept of big data is often explained using the 4 V's: 1. Volume: Refers to the sheer amount of data generated and collected. With the proliferation of devices and sensors, data is produced at an unprecedented scale. For instance, terabytes or petabytes of data collected from various sources like social media, sensors, or transactions. 2. Velocity: Indicates the speed at which data is generated, collected, and processed. Big data often arrives rapidly and needs to be processed swiftly to derive insights in real-time or near real-time. For instance, streams of social media updates, online transactions, or sensor data from machines. 3. Variety: Encompasses the diverse types of data available—structured, semi-structured, and unstructured. Big data includes different formats like text, images, videos, sensor data, log files, etc. Managing this variety requires flexible tools and approaches to extract value. 4. Veracity: Refers to the reliability and accuracy of the data. Big data might come from various sources, and ensuring its quality and reliability is crucial for making informed decisions. Data inconsistencies, errors, or biases can impact the analysis and insights drawn from it. ⇨ Data Analytics V/S Data Science V/S Big Data (MST) 7
Data Science/ Unit-1 Aspect Data Analytics Data Science Big Data Focus Analyzing historical data Predictive analysis, insights Processing and analyzing vast volumes of data Goal Extract insights from data Solve complex problems, predictions Manage and process large datasets efficiently Techniques Statistical analysis, visualizations Machine learning, advanced analytics Distributed computing, parallel processing Data Size Moderate-sized datasets Varied sizes, including large Extremely large datasets, often in petabytes Tools Excel, SQL, BI tools Python, R, Hadoop, Spark Hadoop, Spark, NoSQL databases Applications Business intelligence, reporting Predictive modeling, recommendation systems Scalable data processing, real-time analytics ⇨ Business Intelligence V/S Business Analytics Feature Business Intelligence (BI) Business Analytics (BA) Focus Historical data, reporting Predictive and prescriptive analysis Purpose Descriptive insights Decision-making, future planning Data Type Structured data Structured and unstructured data Time Horizon Past, present Past, present, future Scope Narrow (specific queries) Broad (exploration, discovery) Tools Reporting tools, dashboards Statistical analysis, machine learning Users Executives, managers Data scientists, analysts, decision-makers Query Complexity Simple queries Complex queries, algorithms Visualization Standard charts, graphs Advanced visualizations, predictive models 8

Fleepit Digital © 2021