S T U D I O S PYQs DATA SCIENCE BTECH 3RD YEAR SHEET

Total No. of Printed Pages:3 Enrollment No...................................... Faculty of Engineering End Sem (Odd) Examination Dec-2019 CS3ED06 / IT3ED07 Data Science Programme: B.Tech. Duration: 3 Hrs. Branch/Specialisation: CS/IT Maximum Marks: 60 Note: All questions are compulsory. Internal choices, if any, are indicated. Answers of Q.1 (MCQs) should be written in full instead of only a, b, c or d. Q.1 i. ii. iii. iv. v. Point out the correct statement: 1 (a) Raw data is original source of data (b) Pre-processed data is original source of data (c) Raw data is the data obtained after processing steps (d) None of these Data Scientist should have the skills of: 1 (a) Computer Science (b) Statistics (c) Both (a) and (b) (d) None of these The joint probability is: 1 (a) The likelihood of two events happening together (b) The likelihood of an event happening given that another event has already happened (c) Based on two mutually exclusive events (d) Also called Prior probability A listing of the possible outcomes of an experiment and their 1 corresponding probability is called (a) Random Variable (b) Contingency table (c) Bayesian Table (d) Probability Distribution A histogram: 1 (a) Is a graphic representation of the frequency distribution of a continuous variable (b) Is a graphic representation of the frequency distribution of a qualitative or categorical variable (c) Is an alternative to a pie chart (d) Is a bar chart P.T.O.

vi. vii. viii. ix. x. Q.2 i. ii. iii. OR iv. Q.3 i. ii. OR iii. Q.4 i. ii. [3] Which of the following information is not given by five-number summary? (a) Mean (b) Median (c) Mode (d) All of these Which plot might you use to show the relationship between attitudes towards exercise and physical fitness levels? (a) Box and whisker plot. (b) Stem and leaf plot. (c) Scatter plot (d) Histogram Which of the following graph can be used for simple summarization of data? (a) Scatter plot (b) Word cloud (c) Bar plot (d) All of these Which one is the python library? (a) Scikit-Learn (b) PyBrain (c) NumPy (d) All of these Which of these libraries contains a lot of efficient tools for machine learning and statistical modelling? (a) Scikit-Learn (b) SciPy (c) NumPy (d) Matplotlib 1 What are different skills required for data scientist? Give four points. How data science is important in today’s business world? What are primary components of data science? Discuss working of every component. Discuss about basic framework of data science in detail. 2 OR iii. Explain any case study using data science process. 7 Q.5 i. What is data visualization? Why it is important in data science? Give two reasons. What are the essential points of effective data visualization? Explain each in brief. Explain any three comparison charts in data visualization with diagram. 4 1 ii. OR iii. 1 Q.6 i. 1 ii. 1 iii. Attempt any two: Explain following python libraries with example: (a) Scikit-Learn (b) Matplotlib How python is useful in data science process? Give any four characteristics in detail. Describe challenges of Data Science project management ****** 3 5 5 What is the conditional probability in statistics? Give example. Explain descriptive and predictive analytics. Also give name of primary tools used in descriptive and predictive analytics. Discuss about statistical modelling and statistical inference in detail. 2 8 What is the importance of exploratory data analysis in data science? Give three points. Explain any four tools of exploratory data analysis. Describe box plot with its five-number summary. 3 8 7 6 6 5 5 5
![[2] [2]](./files/688f9edebaa04491f21878f237ca98fa/small_images/pg_3-L-0.jpg)
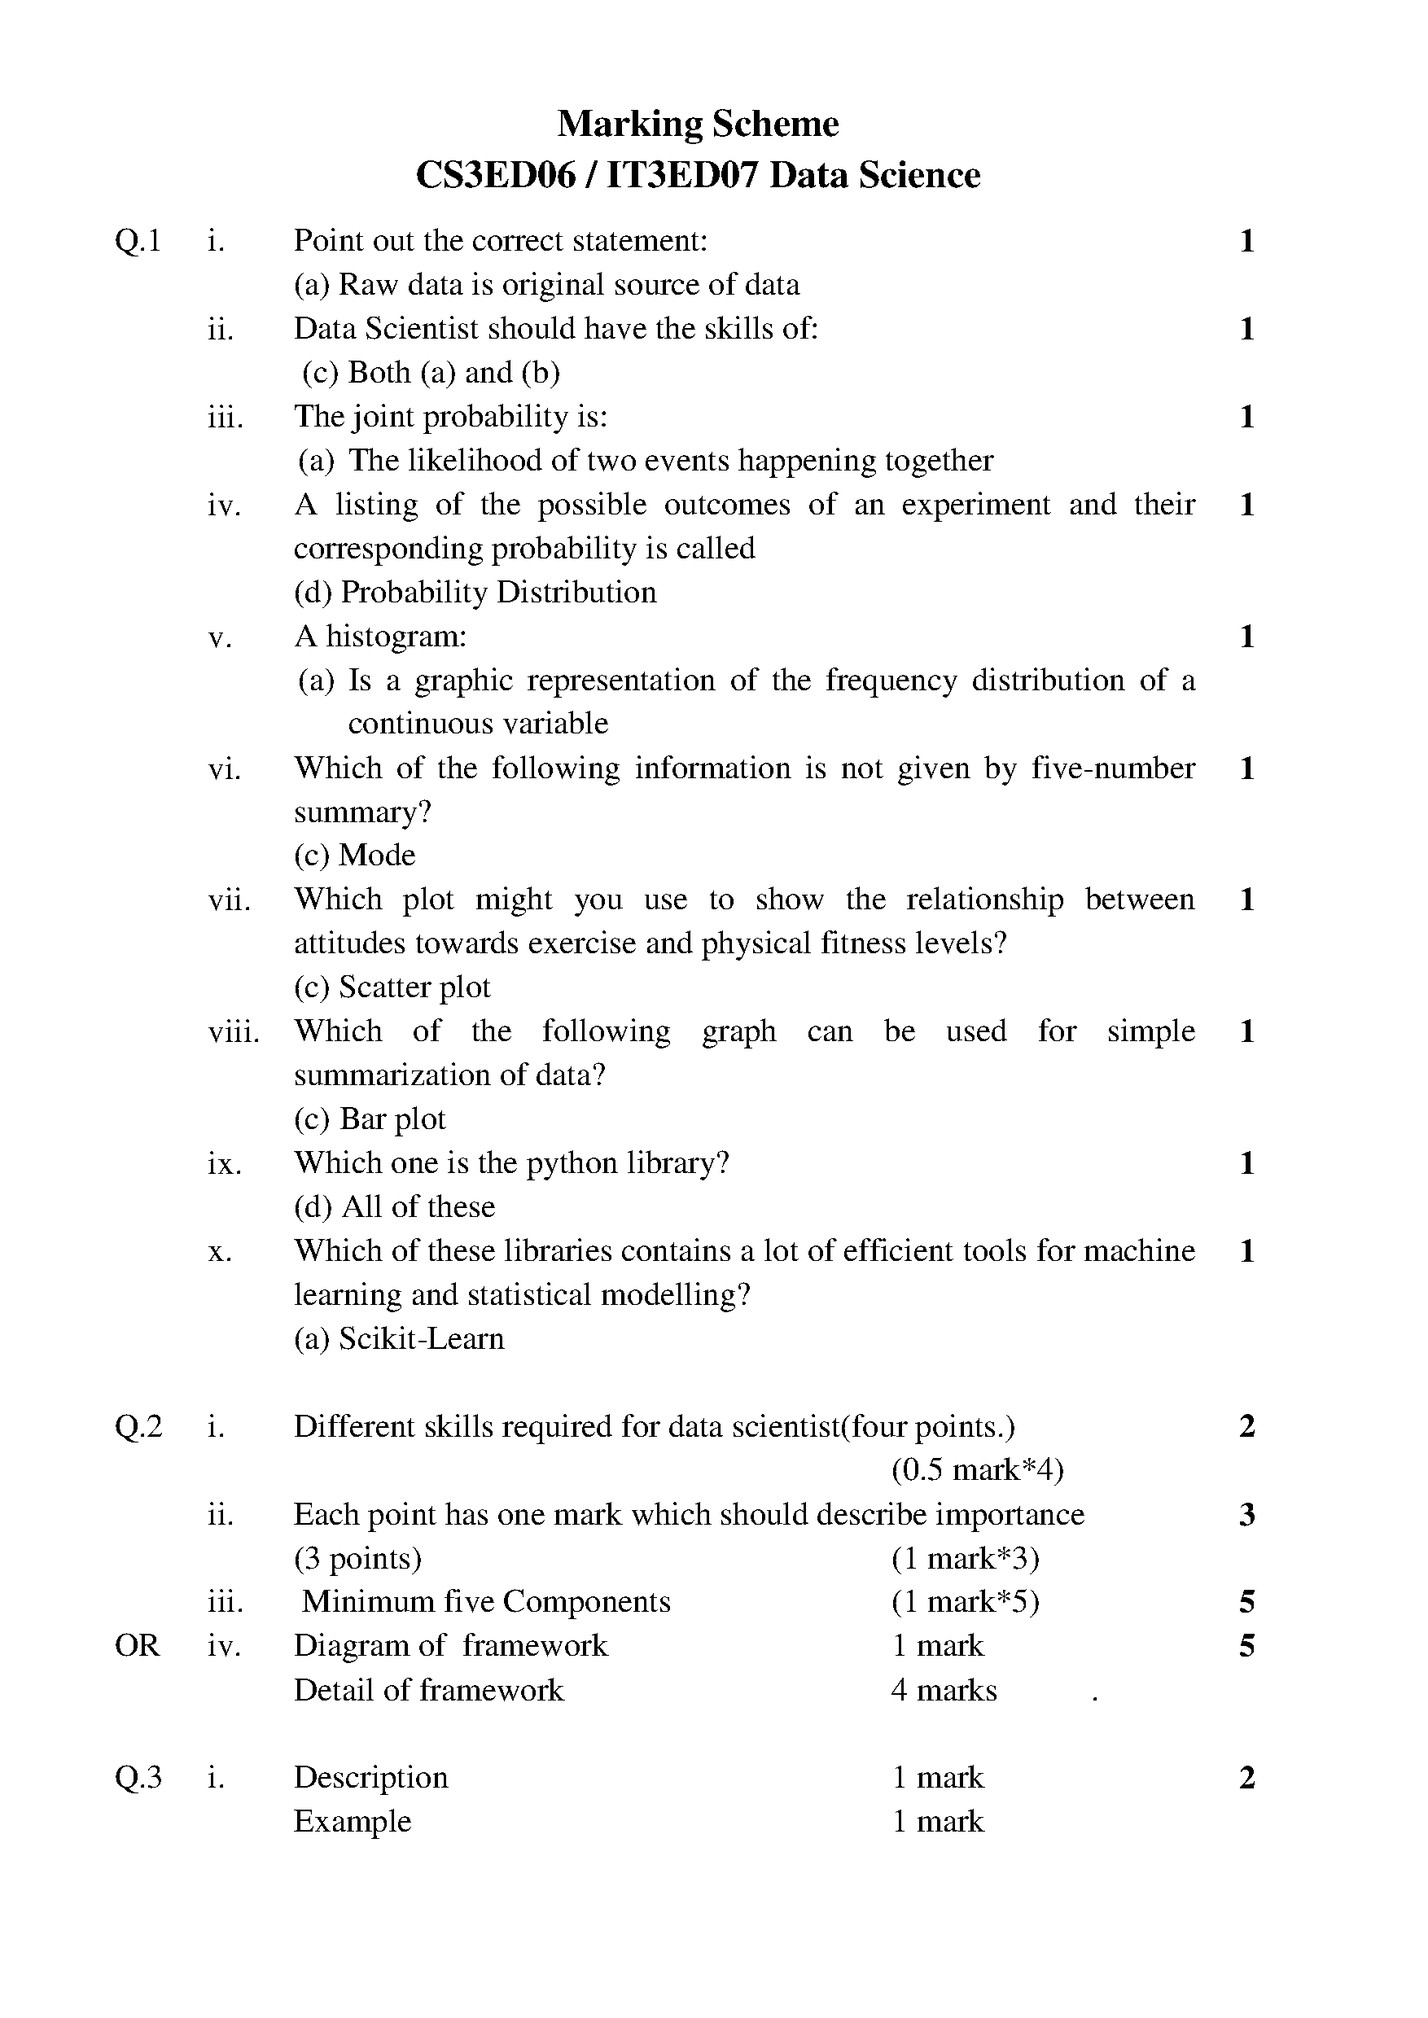
Marking Scheme CS3ED06 / IT3ED07 Data Science Q.1 i. Point out the correct statement: (a) Raw data is original source of data Data Scientist should have the skills of: ii. (c) Both (a) and (b) The joint probability is: iii. (a) The likelihood of two events happening together A listing of the possible outcomes of an experiment and their iv. corresponding probability is called (d) Probability Distribution A histogram: v. (a) Is a graphic representation of the frequency distribution of a continuous variable Which of the following information is not given by five-number vi. summary? (c) Mode vii. Which plot might you use to show the relationship between attitudes towards exercise and physical fitness levels? (c) Scatter plot viii. Which of the following graph can be used for simple summarization of data? (c) Bar plot Which one is the python library? ix. (d) All of these x. Which of these libraries contains a lot of efficient tools for machine learning and statistical modelling? (a) Scikit-Learn 1 i. Different skills required for data scientist(four points.) (0.5 mark*4) Each point has one mark which should describe importance (3 points) (1 mark*3) Minimum five Components (1 mark*5) Diagram of framework 1 mark Detail of framework 4 marks . 2 Description Example 2 OR iii. Q.4 i. 1 1 1 ii. OR iii. Q.5 i. 1 1 ii. 1 OR 1 Q.6 iii. i. 1 1 ii. Q.2 ii. OR iii. iv. Q.3 i. 1 mark 1 mark iii. Description of descriptive analytics Description of predictive analytics Name of tools of descriptive Name of tools of predictive Description of statistical modelling Description of statistical inference 8 8 Importance of exploratory data analysis in data science (Three points.) (1 mark*3) Four tools should be described in detail 4 marks Description of Box plot with diagram 3 marks Description of case study using data science process. (As per answer) 7 marks 3 Description of data visualization 2 marks Description of data visualization 2 marks Essential points of effective data visualization Each point in brief (1 mark*6) Three comparison charts in data visualization with diagram. (2 marks*3) 4 Attempt any two: Explain following python libraries with example: (a) Scikit-Learn Description 1 mark Example 1.5 mark (b) Matplotlib Description 1 mark Example 1.5 mark Uses of python 1 mark Four characteristics in detail (1 mark*4) Description of 5 challenges (1 mark*5) 3 ****** 5 5 3 marks 3 marks. 1 mark 1 mark 4 marks 4 marks 7 7 6 6 5 5 5

Fleepit Digital © 2021